
"De Luca on FDD Newsletter" Issue 1
Getting Flexible with Planning
| Flexibility is available by planning in client-valued terms and at a level of granularity that makes planning easier and remains acceptable to clients. By planning Business Activities with completion dates specified as a month, there is further considerable flexibility available for the scheduling of detailed tasks during the construction phase of a project. Both of these levels of flexibility are highly valued by project managers. |
Once we have completed the Build Features List process we have a categorized list of features. The top-level category is the Subject Area. These in turn contain Business Activities, that are broken down into features.
When it comes to the Plan By Feature process we are producing, amongst other things, the development plan. Using the categorized features list we plan dates at the level of a Business Activity and only at the granularity of month and year.
As the entire features list has meaning to the client - they are OK with plan dates that to us I.T. folk can seem far too coarse. For example, consider two Business Activities from the domain of Lending (Banking): Credit Evaluation and Loan Approval. If we tell the client they will get Credit Evaluation in February and they will get Loan Approval in March they are fine with that. Those things are relevant and make sense to the client. Remember that all features are expressed in client-valued terms and that the categorization of features into Business Activities is in fact simple functional decomposition of the domain - of their business. These things combined make it easy for the client to accept such dates.
Look at this parking lot chart example from another domain (figure 1). Every Business Activity on it has a planned completion date expressed as a month and year. Clients are fine with such a plan. Every box on that chart means something to them.
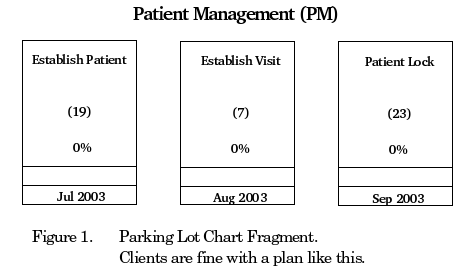
However, if we set a plan that says that discrete feature number PM037 - determine the next scheduled Visit for a Patient - will be delivered on Friday the 23rd at 3pm, then if it isn't delivered at exactly 3pm on Friday the 23rd we have a "please explain" problem. It is most likely that this single feature being delivered at a time later than published is not a problem at all, but we still have created ourselves a reporting, and potential "please explain," problem.
Project managers can be really good at creating problems for themselves and this is one example of such a self-created problem.
So, we plan and estimate at the level of Business Activity and month and year. Not at the level of individual features linked together (bottom-up) as is often done with a Gantt chart.
Many Project tools make bottom-up task level planning easy to do. We simply open up the tool and start entering tasks. Task 1 is do this thing and that will take about a day. Task 2 is do that thing it it will take half a day. Task 3 will take 2 days, and so on. Then all we have to do is simply swipe select the tasks, click the link button (figure 2) and there we have it: an instant Gantt chart!
There are several problems with this, and here's a discussion of just two of them.
The first is that a Gantt chart is supposed to be resource (people) leveled. It is the utilization of resources and their assignments to tasks that drives the layout of the task bars - in conjunction with finish-start type links between tasks. The simplistic task entry and link approach described previously, completely ignores resource leveling.
The second problem is that there's a massive compound error introduced by trying to estimate each of a very large number of small tasks. The small over-estimates in each task add up to a huge error across the total project.

This is why when we've finished entering all the tasks and their durations and then click the link button we see 4 years for what's supposed to be 15 months worth of work. So, what happens next? Well, we start to drag in those magic Gantt chart bars. You know the ones; they're just like the one below (figure 3). So, we adjust these bars until the overall end date gets close to what our gut thinks or what we know is needed. In this case, somewhere around 15 months.

It's amazing and it's true. I've watched people do this time and again and it is amazing how we can blind ourselves to what is actually happening - which in this case is to undermine our very own Gantt chart work.
A proper Gantt chart is resource leveled rather than simplistically task linked with finish-start links, however very few people use a Gantt chart the proper way. Why? Because it's hard to do and takes a substantial amount of time. Now, imagine resource leveling at the level of granularity of Feature Driven Development features. A granular feature like "generate the unique number for an Order" might be only hours worth of work. When that feature is broken down into the the six discrete milestones required by Feature Driven Development to complete a feature, the task durations are now down to minutes. An extra long toilet visit will break our resource leveled plan.
The operational reality is that a large percentage of Gantt charts are a fantasy of our own making. They're really little more than pretty pictures. But, they're pretty pictures that some rigorous process, or process department, demands. Note: not demands "is useful" but simply demands "is produced."
OK, so we've seen that clients are actually fine with month and year completion dates at the level of a Business Activity in our plan. We've also seen how bottom-up style estimating is flawed and unsuitable for the granularity of features in a Feature Driven Development Project.
There is another big win from keeping the planned completion dates at the level of a Business Activity and at the granularity of month and year when planning and estimating in Plan By Feature Process. That "win" is that we gain a lot of flexibility during the construction phase. This flexibility comes in terms of planning, scheduling, and estimating discrete features or packages of features through the Design By Feature and Build By Feature processes.
As long as we're hitting the completion of whole Business Activities by the month and year set in the plan, we have a lot of flexibility with the features contained by Business Activities. This is touching on a crucial workflow in Feature Driven Development that is the topic of a forthcoming "De Luca on FDD" newsletter.
© Nebulon Pty. Ltd.

FDD, Gannt charts and coupling
I seem to advise someone at least once a month - 'Don't couple things you don't have to couple!'. Why people want to do this is a subject for psychologists and not the point of this post.
One of the strengths of FDD is it encourages loose coupling. Whereas Gannt charts encourage tight coupling. Coupling is bad because it makes resource loading difficult (I have never achieved 100% loading for all resources in a Gannt chart) and causes problems to rapidly propagate - simply put, if one thing slips then everything slips. Think of manufacturing to understand why. In a tightly coupled environment (an assembly line), if one part of the line stops then it all stops. Whereas in a loosely coupled environment (typical of most small to medium scale manufacturing) each step in the manufacturing process is loosely coupled with the other steps and a problem does not immediately propagate to downstream steps because of in-process inventory and the ability to switch jobs at short notice - giving management time to fix the problem. The main disadvantage of loose coupling is the money tied up in-process inventory. However, I have yet to hear anyone complain about the costs of in-process software inventory - despite the very real and substantial costs it represents. The challenge in managing the loosely coupled manufacturing process is to optimally load each manufacturing step, while delivering to planned dates. And BTW these loosely coupled processes scale easily, facilitate out-sourcing, and allow collection of detailed metrics.
In the manufacturing world this is variously called discrete, batch or made-to-order manufacturing. The planning process is well understood based on bill-of-materials, work centres and order flows. Work center loading becomes the key visual chart - much more informative to a manager than a Gannt chart. Customers get agreed product specs and delivery dates.
I think FDD should explicitly adopt this type of planning model.
Phil
Aggregation reduces uncertainty (variability)
In reply to both Jeff and Phil's comments, I would point those interested in the underlying theory to Donald Reinertsen's "Managing the Design Factory" which explains the mathematical theory behind what Jeff is saying in this article.
The Gantt chart - coupled - linear progression of tasks with individual delivery dates suffers from what is known as "the local safety problem". This is a psychological effect which causes the individual doing the estimate to overly buffer the estimated time in order to meet the delivery date - for the individual line item. This buffer is caused by uncertainty - the buffer is a protection against uncertainty. Hence, each Feature becomes hideously overly estimated - typically results can be as much as 200% over.
The specific references in Reinertsen's book are pages 93 & 212. Ironically, I bought this book in MPH Singapore in 1997 but didn't read it thoroughly until recently. Duh!
The mathematical result is that aggregation of uncertainties results in the aggregated uncertainty becoming the square root of the sum of the squares of the individual uncertainty, i.e. the buffer needed for a full Subject Area of Features is much less than the buffer needed for an individual Feature.
In plain English, this is saying, exactly what Phil has said, don't create dependency between things which do not need it. Generally speaking there is only ever a need to create dependency in FDD between a few Feature Sets or Subject Areas e.g. a UI Feature Set has a dependency on its related PD Feature Set.
There is a perfectly good PERT chart derived solution for documenting these dependencies described in Eli Goldratt's "Critical Chain".
I will be describing how to use Critical Chain techniques in FDD Planning in an article later this Spring.
In summary - all of this is proof that the existing PMI/ISO 9000 project management model doesn't work for software development - at least not at a fine grained level. The Agile notion that self-organizing from below is more appropriate seems to work at the fine grained level. Overall, my feeling is that it is best to plan, at the Subject Area level unless there is a specific need to plan some Feature Sets - allow the activity within a Feature Set to be entirely self-organizing and use the Issue Log (Features Blocked report) to manage the Critical Path, buffers should be created at the Subject Area level and for specific Feature Sets where dependencies lie.
Phil also mentions, manufacturing work center planning and BOM. I would like to further suggest that the Feature List is essentially the BOM for FDD and that it is best reported using a Cummulative Flow Diagram widely used in manufacturing to track the flow of value through the system. I will post an example of a cummulative flow diagram on this site soon. I would propose that we use it as a replacement for the current Features Complete graph.
More and more, I'm finding that much of what we are doing with FDD seems to be a solved problem in manufacturing. We seem to have reinvented the wheel - but for knowledge work - and that is very cool. The advantage of realizing that many of these techniques already exist is that it now gives us a language with which to scientifically explain the advantages of the methods is use with FDD.
I apologize if this seems like an incomplete ramble through some complex material. It will take two full articles to explain all of this adequately and I don't have time for that today. Meantime, I would recommend "Critcal Chain" and "Managing the Design Factory" as essential reading for anyone interested in FDD management and extending the state-of-the-art in FDD.
David
--
David J. Anderson
http://www.uidesign.net/
The Webzine for Interaction Designers
Critical Chain Project Management
Phil,
This medium doesn't really allow me to answer you fully. Suffice to say that I feel we both think along similar lines in respect to this. My full answer to you is really contained in my book and runs to perhaps 100 pages of the 336 pages.
I think that you would greatly enjoy Critical Chain (a novel) by Eli Goldratt, or the formal Critical Chain Project Management by Larry Leach. CCPM as it is known has got a lot of coverage recently in the Cutter IT Journal and I have a forthcoming article in the October edition which teaches how to use the CCPM multi-project solution in the PMO of a large software organization. This article represents what's been called "the missing chapter" of the book.
I dedicate a whole chapter to explaining how to use CCPM with FDD in the Plan-by-Feature step and I believe it represents a significant improvement. It put a formal framework around what Jeff has been already talked about in his Getting Flexible with Planning letter earlier this year.
The book will be in stores on 22nd September.
Cheers,
David
--
David J. Anderson
author of "Agile Management for Software Engineering"
http://www.agilemanagement.net/
Feedback
Very nice article!
Forwarded to a team I'm working with who have Gantt chart problems. Feedback: I had to explain the parking lot diagram snippet because they did not immediately guess the domain of the example and they did not understand the meaning we associate with the word 'establish' (I tend to use edit instead of establish these days for exactly this reason). This was unfortunate because it meant that the parking example lot did not mean anything to them. Without the color you lose alot of the power of the parking lot chart too.
Otherwise very useful in chipping away at the fixed mindsets and preconceived ideas.
Have fun
Steve
Never attribute to malice what can adequately be ascribed to incompetence
Thanks
Thanks for the feedback Steve. Extra words to explain the parking lot fragment would have helped your group. I'll keep this in mind for the future.
I dislike using Edit - far too I.T. for me when this is decomposition of the domain.
The parking lots are white on purpose as they should be when discussing the plan. i.e. "not started".
Jeff
Newbie Feedback and Some Comments
I have been reading the book "A Practical Guide to FDD" and this purposes a different mideset for establishing feature dates. Although I understand what has been said, my projects are short termed (4 months average). Due to this, shceduling feature sets by month may not be adequate in order to measure project progression in my case.
Another issue that rises in comparison to the book mentioned, that clearly advocates setting dates by day/month for features, is that I suspect that in one way or another WorkPackages tend to be "as much" as the number of feature sets (after all a feature set is a list of functions required by a business process (moment-interval?) in this case. I don't know if this is desirable yet. This is to say that scheduling deliveries by day/month may help to keep descipline.
Measuring the complexity of little "things", then estimating time for their implementation is easier then for large sets of "things". This is to say that Chief Programmers are used to measure little things, not big things (at least the ones that I've worked with) and then their impact on the delivery schedule of a larger set of things.
Having said this, I totally agree that Gantt charts are not good as I don't use them for practical development purposes, and with some adaptations of the current advised practice I will never need them to show progress to my clients too :)
Thanks for the article, it was really helpful.
Best ragards,
Nuno Lopes
Clarifying Dates
> Due to this, shceduling feature sets by month may not be adequate in order to measure project progression in my case.
It might sound like I'm spliting hairs, but the difference is quite important. You don't schedule business activities (feature sets). You schedule features. The features that you schedule may come from the same business activity - but then again they may not.
Of course, you are guided by the sequence of delivery that is stated by month/year target completion dates on business activities, but the scheduling is of features and is at the discretion of the project manager/dev manager.
In terms of reporting and tracking at the business activity level, then sure I can see that this could be a problem. You need to consider this just as much when you are doing the categorisation and planning. In other words, if the business activities don't give you sufficient granularity for tracking then break them down. Of course, you must not over compensate and have them too fine-grained or you recreate all the problems I talked about in the newsletter.
I've done many projects of 4-6 months.
> ...the book mentioned, that clearly advocates setting dates by day/month for features...
For individual features - yes their milestones are set by day/month. There is no disconnect here.
> I suspect that in one way or another WorkPackages tend to be "as much" as the number of feature sets
No - that would be unusual. Your workpackages are too large or the business activities are too small. I guess it could happen, but it's not the norm.
> after all a feature set is a list of functions required by a business process (moment-interval?)
It's tempting to want to connect a business activity to a moment-interval in a colour model but that is not a good thing to do. The features list is orthogonal to the model. This, again, is an important mindset difference. The features list is simple functional decomposition of the domain. The model is not a functional decompostion.
> Measuring the complexity of little "things"...
This is the bottom-up style again. It may appear better at the level of a single discrete little thing as the absolute error is (by definition) also little. However, the cumulative effects are not little and remember that with the granularity of FDD features there is a very significant cumulative effect.
Jeff
Thanks!
I understand now!! There is no disconnect really.
Nuno.
PS: Very nice tips.